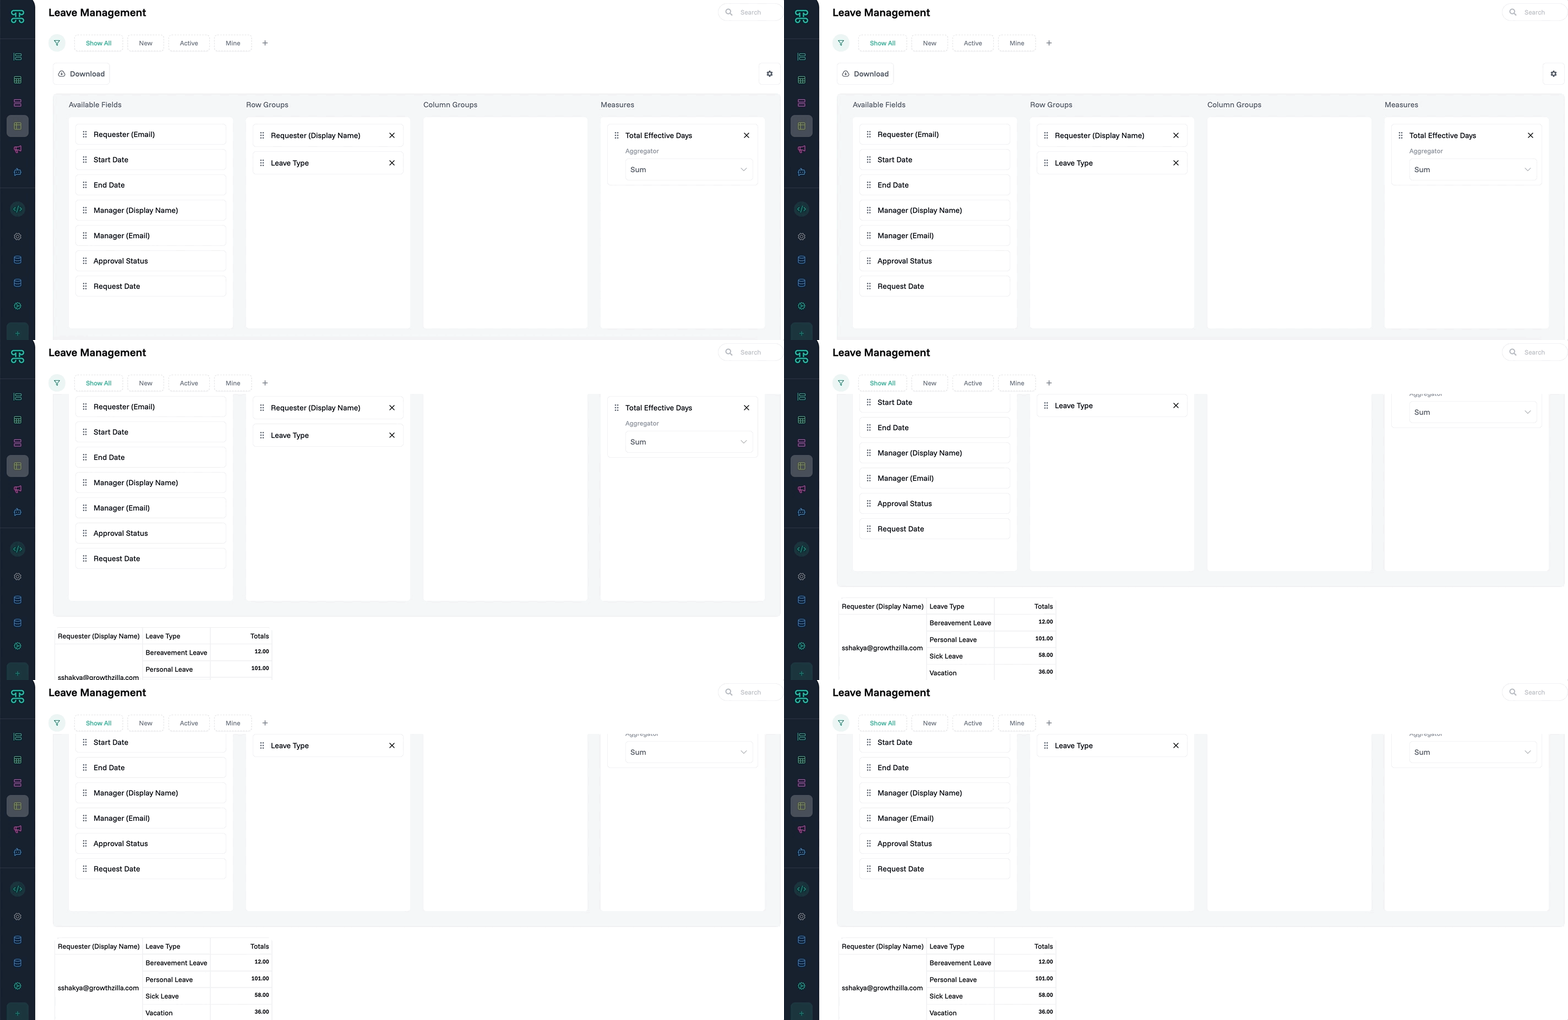
Transform flat data into multidimensional analysis. Pivot interfaces reveal patterns by reorganizing your data across different dimensions—like Excel pivot tables but with live data.
Structure & Behavior
Drag fields to row and column positions to create your analysis grid. Values automatically aggregate at intersection points. Add multiple dimensions for deeper analysis. Expand or collapse grouped data to control detail level.
For example, drag "Product" to rows and "Month" to columns to see sales by product over time. Add "Region" as a sub-row to break down each product by geographic performance. Values update instantly as underlying data changes.
When to Use
Sales Analysis - Compare performance across products, regions, and time periods
Resource Planning - View utilization by department, project, and month
Financial Reporting - Analyze expenses by category, department, and quarter
Inventory Management - Track stock levels by location, product, and supplier
Configuration Options
Choose aggregation methods for values—sum, average, count, min, max. Apply conditional formatting to highlight trends or outliers. Set up drill-through actions to see underlying records. Configure subtotals and grand totals. Export formatted results for presentations or further analysis.