Your business intelligence hub. Dashboards transform raw data into visual insights, helping you spot trends and make informed decisions at a glance.
Structure & Behavior
Think of dashboards as your personal command center built from widgets—modular blocks that each tell part of your data story:
Line Charts: Show trends over time like monthly sales growth
Bar Charts: Compare values across categories like performance by region
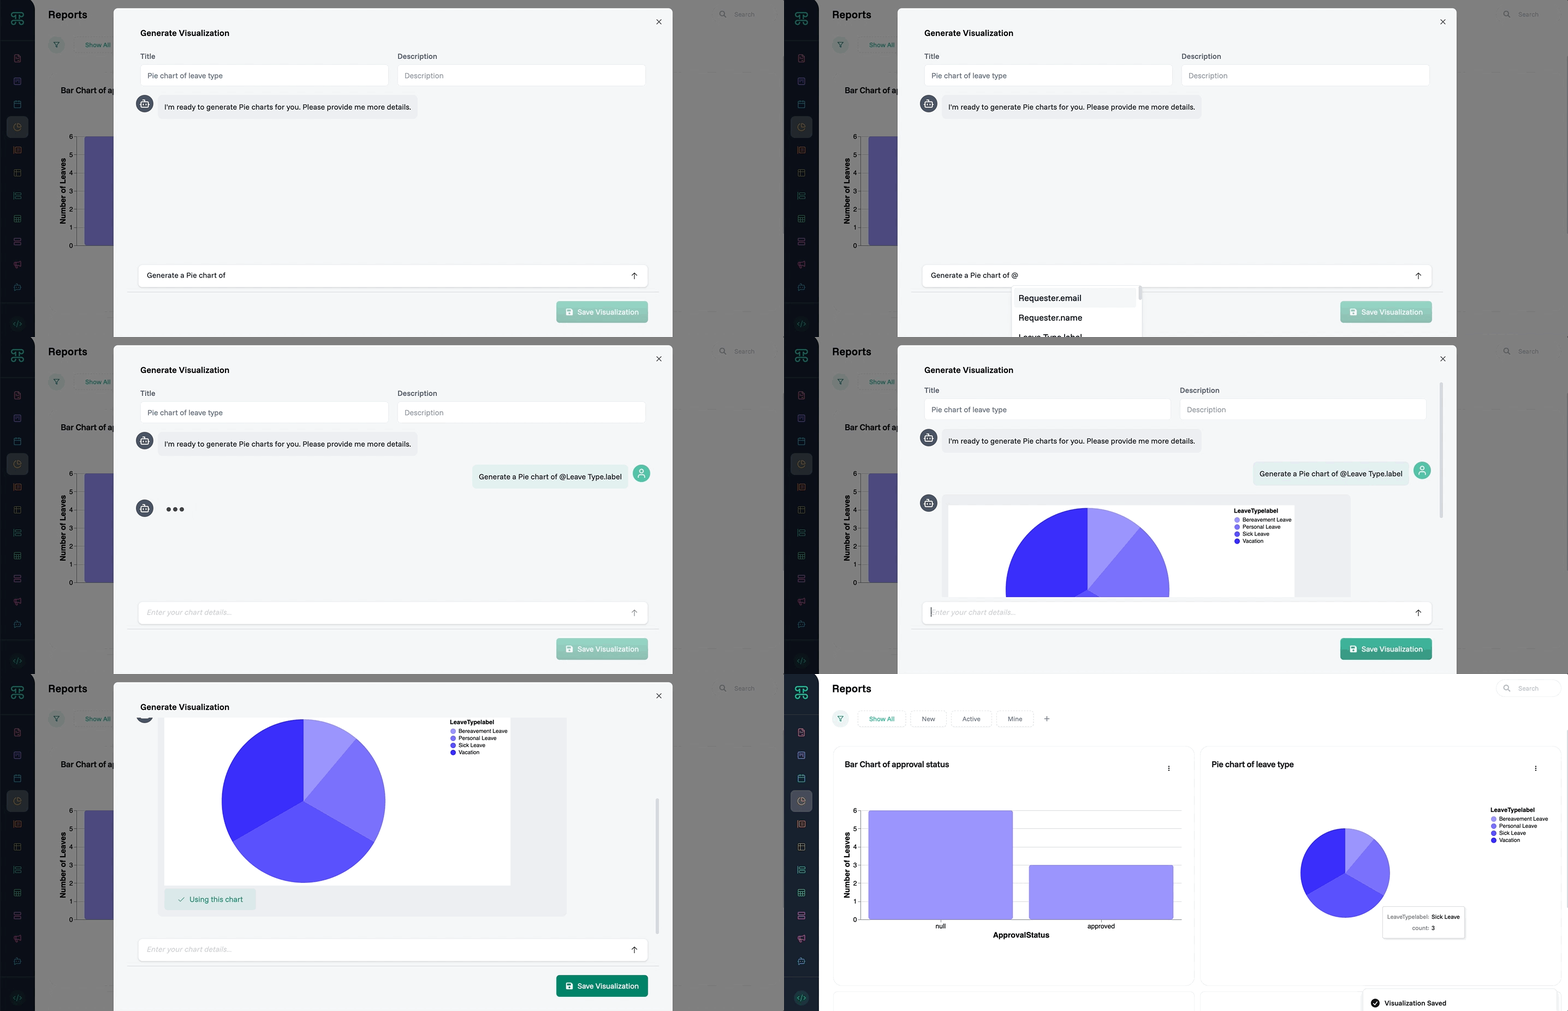
Pie Charts: Visualize proportions like market share breakdown
Scatter Charts: Reveal correlations between variables like price vs. customer satisfaction
Area Charts: Display cumulative values over time like total inventory levels
Trend Charts: Highlight patterns and forecast future values based on historical data
Heatmaps: Show intensity across two dimensions like sales by hour and day of week
Text Charts: Present key insights or summaries in narrative form
Arrange these widgets in a flexible grid. Make important metrics larger. Group related information together. Everything updates automatically as your data changes—no manual refresh needed.
When to Use
Daily Operations: Monitor real-time performance and spot issues early
Team Meetings: Share progress and celebrate wins with visual proof
Client Reviews: Present professional reports that update themselves
Strategic Planning: Base decisions on actual data trends, not gut feelings
Configuration Options
Building dashboards is refreshingly simple. Drag widgets where you want them. Resize by dragging corners. But here's the powerful part—use Proma's AI chatbot to customize everything through natural language:
Tell it "Make the revenue chart green" or "Change to dark theme"
Request "Show data as percentages instead of raw numbers"
Ask to "Generate a Pie chart of @Leave Type.label"
The chatbot understands context and applies changes instantly. No need to hunt through menus or remember specific settings. Just describe what you want to see, and watch your dashboard transform.